Practical DBSCAN Clustering with Python
- Introduction
- Generating sample data
- Feature scaling
- Determining $\varepsilon$ and $minPts$
- Model fitting
- Visualization
- Conclusion
- Additional links
Introduction
Density Based Spatial Clustering of Applications with Noise, DBSCAN for short, is a popular clustering algorithm that can be specially useful for outlier detection and clustering data of varying density. DBSCAN requires the user to specify two hyperparameters:
- $\varepsilon$ (epsilon or eps) - helps form a parameter around a data point.
- $minPts$ - helps identify the core points (points in a dense area). These are the minimum number of core points to be present within the parameter defined above for a cluster to form.
After DBSCAN completes, there will be 3 types of data points identified: 1) core, 2) border, and 3) noise. Thus, DBSCAN “understands” the concept of noise or anomalies and is sensitive to it while clustering. It will therefore assign, for instance, a -1 as cluster number to data points that it finds in sparsely populated regions and help us identify outliers.
Generating sample data
We will use the same synthetically generated clusters that we used while experimenting with KMeans clustering.
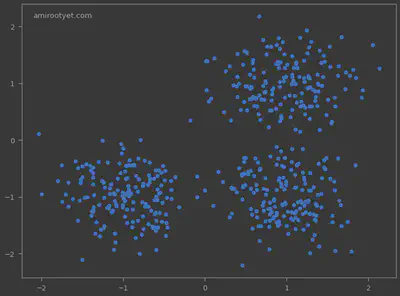
In the generated data points, we clearly see 3 clusters and some outliers. We will now use DBSCAN to detect the clusters and the anomalies.
Feature scaling
Again, same as with KMeans, we will standardize the feature set.
from sklearn.preprocessing import StandardScaler

scaler = StandardScaler()
X = scaler.fit_transform(X)
Determining $\varepsilon$ and $minPts$
As stated before, the choice of both of these input parameters is critical for DBSCAN. How, then, do we accurately determine these 2 parameters for our dataset? Unfortunately, there is no clear way to determine the values of these hyperparameters as they largely depend on the problem we are solving. Roughly, $minPts$ should be indicative of the size of the dataset, that is, as the size of increases so should $minPts$. Similarly, $\varepsilon$ will determine the radius of the clusters and should be chosen accordingly.
Model fitting
After determining $\varepsilon$ and $minPts$, we are ready to perform clustering with DBSCAN.
from sklearn.cluster import DBSCAN

clusterer = DBSCAN(eps=0.3, min_samples=10, metric='euclidean')
y_pred = clusterer.fit_predict(X)
Note that the metric of distance that we are using is Euclidean, which is not always suitable depending on the dataset.
Visualization
plt.figure(figsize=(12,9))
plt.annotate('amirootyet.com', xy=(0.03, 0.95), xycoords='axes fraction')
plt.scatter(X[:, 0], X[:, 1], c=y_pred, s=50, cmap='Dark2')
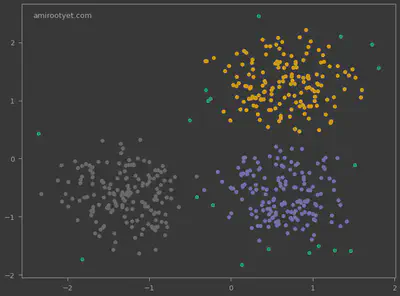
We see that DBSCAN did not just identify the 3 clusters but also the outliers. These outliers are expressed in dependent variable y_pred as -1.
Outlier detection
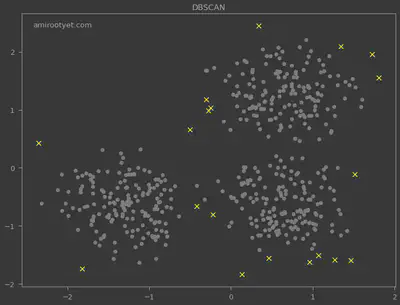
The data points for which the cluster was determined to be -1 are all outliers as judged by the algorithm. They are highlighted below.
plt.scatter(X[y_pred==-1, 0], X[y_pred==-1, 1], c='yellow', s=70, marker='x')
plt.scatter(X[y_pred!=-1, 0], X[y_pred!=-1, 1], c='gray', s=50)
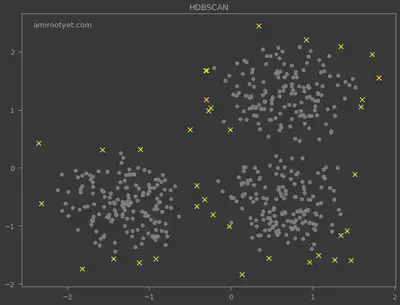
I also deployed the HDBSCAN algorithm for outlier detection and the results are plotted above. Noticeably, HDBSCAN detected more outliers and did not require $\varepsilon$.
Conclusion
One of the things I appreciated about DBSCAN right off the bat, especially when compared to KMeans, is that the user is not required to specify $K$ or the number of clusters. DBSCAN determines $K$ on its own, however, it does need the user to specify $\varepsilon$ and $minPts$. Both $\varepsilon$ and $minPts$ have a direct impact on the number of clusters and therefore must be chosen after carefully studying the dataset.
Another advantage of DBSCAN is its suitability for outlier detection since, unlike KMeans, it does not attempt to force every data point into a cluster. DBSCAN recognizes that some data points reside in sparsely populated regions which is indicative of their anomalous tendencies.
One weakness of DBSCAN is that it is only suitable for datasets where clusters have similar density. Clusters with different densities will be handled inaccurately since DBSCAN does not allow us to specify a $\varepsilon$ and $minPts$ per cluster. Consequently, it can be better to use HDBSCAN in those cases and avoid parameter tuning.
Note: The .ipynb pertaining to this exercise is available on my Github here.
Additional links
Pranshu Bajpai
Principal Security Architect
Pranshu Bajpai, PhD, is a principle security architect..