Parsing Palo Alto syslogs with Logstash
Introduction
Palo Alto Firewalls are capable of forwarding syslogs to a remote location. However, parsing is necessary before these logs can be properly ingested at data ingestion and storage endpoint such as Elasticsearch. Logstash is an excellent choice for performing this parsing or transformation of logs before forwarding it for indexing at Elasticsearch (ECS) so that they can be queried with Kibana.
Installation
It is best to install logstash locally during testing. For Mac, the following brew commands will suffice:
brew install logstash
brew services start logstash
For Ubuntu, installation steps are detailed here.
We will use the following Palo Alto syslog example during these tests:
,2001/01/01 01:01:01,0004A100455,THREAT,vulnerability,148,2001/01/01 01:01:01,216.24.57.1,192.168.0.2,0.0.0.0,0.0.0.0,Main-Outbound,,,web-browsing,vsys1,firewall,irouter,ethernet1/3,ethernet1/1,p-Logging-Local-Profile,2001/01/01 01:01:01,65534,1,80,1433,0,0,0x0,tcp,alert,"",HTTP JavaScript Obfuscation Detected(31825),any,low,
Note: this is a threat log; Other log types, such as traffic logs, can be different.
Logstash pipeline
The following three types of plugins are used in the logstash configuration file that specifies the pipeline:
- input: where are the logs coming from?
- filter: how are the logs being transformed?
- output: where are the logs headed?
In Mac, the config file will be located at: /usr/local/Cellar/logstash/7.8.1/libexec/config
Input
For our tests, we will use stdin as the log input. In the production environment, a log forwarding profile set on the firewall will direct logs towards the logstash endpoint and therefore will include a more complex input plugin that might include TLS protection using the logstash tcp input plugin. However, during testing, our input is simply:
input {
    stdin {}
    }
Filter
Filter is useful in transforming input into expected output. For instance, the firewall syslog is a string of comma separated values. Therefore, the first filter we use is to chop the syslog into individual fields. We need to assign column names to these fields as follows:
csv {
source => "message"
columns => [
                "FUTURE_USE", "ReceiveTime", "SerialNumber", "Type", "Threat_ContentType", "FUTURE_USE",
                "GeneratedTime", "SourceIP", "DestinationIP", "NATSourceIP", "NATDestinationIP", "RuleName",
                "SourceUser", "DestinationUser", "Application", "VirtualSystem", "SourceZone", "DestinationZone",
                "InboundInterface", "OutboundInterface", "LogAction", "FUTURE_USE", "SessionID",
                "RepeatCount", "SourcePort", "DestinationPort", "NATSourcePort", "NATDestinationPort", "Flags",
                "Protocol", "Action", "Bytes", "BytesSent", "BytesReceived", "Packets", "StartTime", "ElapsedTime",
                "Category", "FUTURE_USE", "SequenceNumber", "ActionFlags", "SourceLocation",
                "DestinationLocation", "FUTURE_USE", "PacketsSent", "PacketsReceived", "SessionEndReason",
                "DeviceGroupHierarchyLevel1", "DeviceGroupHierarchyLevel2", "DeviceGroupHierarchyLevel3",
                "DeviceGroupHierarchyLevel4", "VirtualSystemName", "DeviceName", "ActionSource", "SourceVMUUID",
                "DestinationVMUUID", "TunnelID_IMSI", "MonitorTag_IMEI", "ParentSessionID", "ParentStartTime",
                "TunnelType", "SCTPAssociationID", "SCTPChunks", "SCTPChunksSent", "SCTPChunksReceived"
                ]
Output
This plugin allows us to set a location for sending the parsed logs. In production, output can be redirected to, for instance, an Elasticsearch instance on a remote ip:port. For our testing, we will use the stdout.
output {
        stdout {}
        }
Examples
The input, output, and filters plugins can be assembled into the logstash.conf configuration file to get the desired result. On Mac, the logstash configuration is located in:
/usr/local/Cellar/logstash/7.8.1/libexec/config
On Linux (Ubuntu), configuration file is located in:
/etc/logstash/conf.d/config/
In order to run logstash with the custom config:
logstash -f logstash.config --config.reload.automatic
The --config.reload.automatic option is helpful during testing as it automatically loads any changes made in the configuration without having to restart logstash.
If logstash is being run as a service, it is prudent to keep an eye on the logstash log file to notice any errors in case of failures. I usually tail -f the logstash log file to ensure the service started without any errors:
tail -f /usr/local/Cellar/logstash/7.8.1/libexec/logs/logstash-plain.log
In Ubuntu, the log files for logstash are located at:
/var/log/logstash
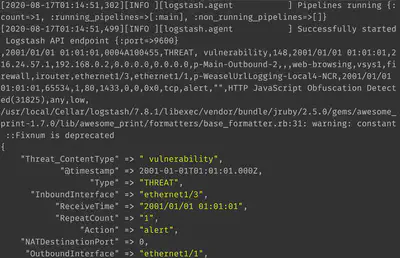
Assigning labels to logs
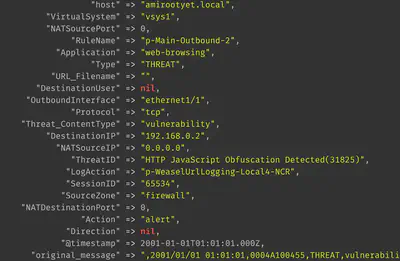
Using the configuration of input, filters, and output shown so far, we assign labels to Palo Alto logs and display the output as follows:
Changing the @timestamp
By default, logstash will assign the @timestamp of when the log was processed by logstash:
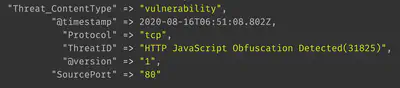
However, in our case, we want the @timestamp to reflect the ReceiveTime observed in the Palo Alto firewall log message.
This is achieved by adding the following filter:
date {
        timezone => "Etc/GMT0"
        match => [ "timestamp", "YYYY/MM/dd HH:mm:ss" ]
    }
The ReceiveTime column date is now correctly ingested as the @timestamp as shown:
Modifying log labels and values
The mutate plugin is very useful for performing modifications as required. It can:
-
rename a column:
mutate { rename => ["message", "raw_message" ] } -
(add and) drop a column:
mutate { remove_field => [ "TunnelID_IMSI" ] } -
add (and remove) a tag:
mutate { add_tag => ["PAN-OS_threat"] } -
changing datatypes:
  mutate {
          convert => {"source.bytes" => "integer"}
  }
Only integer, string, and boolean data types are permitted.
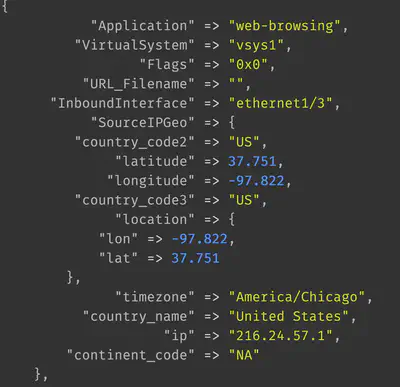
Resolving IPs to geographic locations
The GeoIP plugin in logstash uses the GeoIP2 database to resolved IP addresses to locations. It comes bundled with logstash so no dynamic network lookup is performed during the resolution.
geoip {
        source => "SourceAddress"
        target => "SourceGeo"
    }
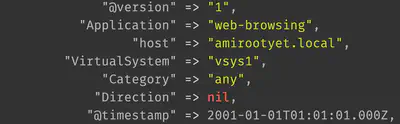
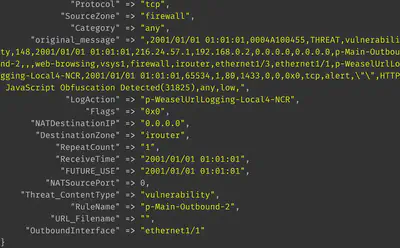
Handling missing values
The Palo Alto firewall will leave some fields blank in the raw log message since not every field need have a value in every log message:
These values need to be appropriately handled at logstash. We can add the following ruby plugin, for instance, that removes all columns with missing values:
ruby {
        code => "
            hash = event.to_hash
            hash.each do |palofield,fieldvalue|
                if fieldvalue == nil
                    event.remove(palofield)
                end
            end
            "
        }
Obtaining JSON output
It is quite straightforward to obtain JSON output from the key-value pairs. Embed the following plugin within output:
stdout { codec => json }
It is also possible to redirect output to a file or an HTTP request.
Best practices when using logstash
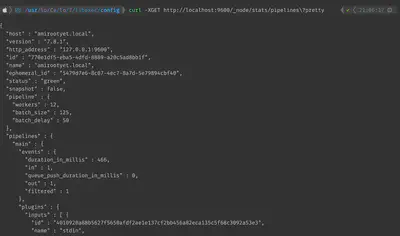
Collecting logstash information
curl -XGET http://localhost:9600/_node/stats/pipelines?pretty
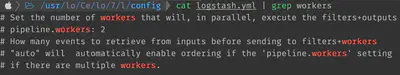
Modifying the number of ‘workers’
The logstash workers control the volume of logs that can be parallely processed. At times, increasing the number of workers is beneficial. This modification can be done in the logstash.yml file as shown.
Using the panw filebeats plugin
If you have deployed [filebeats] in your architecture, then it is possible to save some time by using the panw filebeats plugin that will automatically parse the Palo Alto logs and perform standard ECS fields mapping. When using logstash, it is best to map Palo Alto fields to ECS standard fields by looking at panw documentation.
Related links
- https://github.com/shadow-box/Palo-Alto-Networks-ELK-Stack
- https://anderikistan.com/2016/03/26/elk-palo-alto-networks/
- https://docs.logz.io/shipping/log-sources/palo-alto-networks.html
- https://github.com/elastic/ecs/issues/352
- https://github.com/Netflix-Skunkworks/logstash-configs
- https://www.elastic.co/guide/en/logstash/current/node-stats-api.html#pipeline-stats
The complete starter logstash.conf is available here.
Thanks for reading and happy logstashing!
Pranshu Bajpai
Principal Security Architect
Pranshu Bajpai, PhD, is a principle security architect..